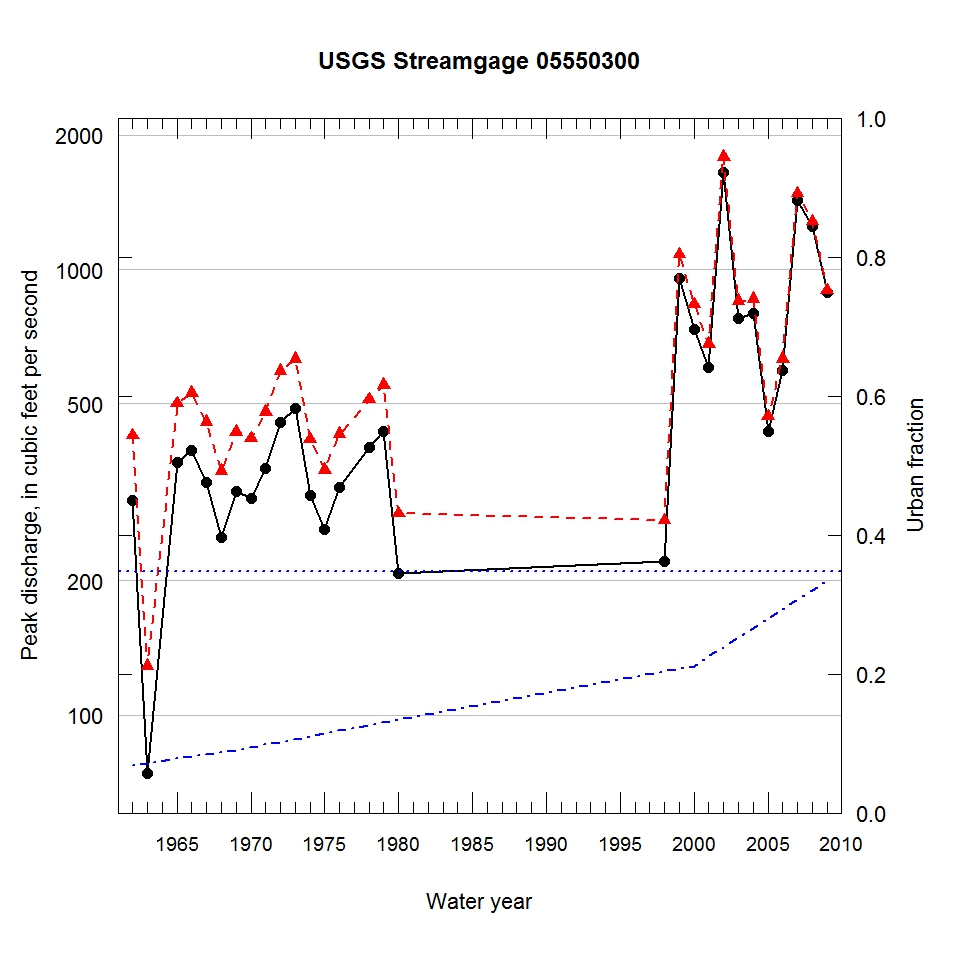
Observed and urbanization-adjusted annual maximum peak discharge and associated urban fraction and precipitation values at USGS streamgage:
05550300 TYLER CREEK AT ELGIN, IL


| Water year | Segment | Discharge code | Cumulative reservoir storage (acre-feet) | Urban fraction | Precipitation (inches) | Observed peak discharge (ft3/s) | Adjusted peak discharge (ft3/s) | Exceedance probability |
| 1962 | 1 | -- | 0 | 0.068 | 0.264 | 303 | 424 | 0.656 |
| 1963 | 1 | -- | 0 | 0.072 | 1.416 | 74 | 129 | 0.977 |
| 1965 | 1 | -- | 0 | 0.078 | 0.711 | 368 | 500 | 0.535 |
| 1966 | 1 | -- | 0 | 0.081 | 0.938 | 392 | 528 | 0.490 |
| 1967 | 1 | -- | 0 | 0.084 | 2.936 | 333 | 454 | 0.613 |
| 1968 | 1 | -- | 0 | 0.088 | 3.327 | 251 | 353 | 0.765 |
| 1969 | 1 | -- | 0 | 0.091 | 0.109 | 318 | 432 | 0.644 |
| 1970 | 1 | -- | 0 | 0.094 | 2.145 | 306 | 417 | 0.668 |
| 1971 | 1 | -- | 0 | 0.098 | 0.346 | 358 | 478 | 0.574 |
| 1972 | 1 | -- | 0 | 0.102 | 1.391 | 454 | 592 | 0.401 |
| 1973 | 1 | -- | 0 | 0.106 | 2.136 | 488 | 629 | 0.357 |
| 1974 | 1 | -- | 0 | 0.110 | 1.133 | 311 | 415 | 0.670 |
| 1975 | 1 | -- | 0 | 0.114 | 1.523 | 261 | 355 | 0.764 |
| 1976 | 1 | -- | 0 | 0.118 | 1.635 | 324 | 427 | 0.652 |
| 1978 | 1 | -- | 0 | 0.126 | 2.389 | 398 | 511 | 0.517 |
| 1979 | 1 | -- | 0 | 0.130 | 1.601 | 432 | 550 | 0.460 |
| 1980 | 1 | -- | 0 | 0.134 | 0.374 | 208 | 283 | 0.855 |
| 1998 | 1 | CE | 65 | 0.204 | 0.627 | 221 | 273 | 0.869 |
| 1999 | 1 | C | 65 | 0.208 | 1.087 | 953 | 1080 | 0.076 |
| 2000 | 1 | C | 65 | 0.211 | 1.024 | 735 | 834 | 0.174 |
| 2001 | 1 | C | 65 | 0.225 | 0.670 | 602 | 681 | 0.296 |
| 2002 | 1 | C | 65 | 0.239 | 1.990 | 1650 | 1790 | 0.016 |
| 2003 | 1 | C | 65 | 0.252 | 0.917 | 778 | 850 | 0.166 |
| 2004 | 1 | C | 65 | 0.266 | 1.501 | 795 | 858 | 0.163 |
| 2005 | 1 | CE | 477 | 0.280 | 0.768 | 432 | 468 | 0.591 |
| 2006 | 1 | C | 477 | 0.293 | 0.299 | 595 | 630 | 0.354 |
| 2007 | 1 | C | 477 | 0.307 | 2.199 | 1430 | 1480 | 0.028 |
| 2008 | 1 | C | 477 | 0.321 | 3.782 | 1250 | 1280 | 0.045 |
| 2009 | 1 | C | 477 | 0.335 | 0.699 | 886 | 897 | 0.143 |

